Revision History
|
Rev. |
Description of Modification |
Date |
|
0. |
First issue for comments |
14/7/2022 |
|
1. |
Revised according to IECs comment |
17/8/2022 |
|
2. |
Revised according to IECs comment |
26/8/2022 |
|
3. |
Revised according to IECs comment |
20/9/2022 |
|
4. |
Revised according to IECs comment |
30/9/2022 |
|
5. |
Revised according to IECs comment |
7/10/2022 |
|
6. |
Proposal of Dry Season Action and Limit Levels |
3/2/2023 |
|
7. |
Revised according to IECs comment |
16/3/2023 |
|
8. |
Revised according to EPDs comments |
23/8/2023 |
Table of Content
2.2 Monitoring Equipment and Methodology
2.3 Monitoring Parameters, Frequency and Duration
3.2 Water Quality Parameters and Monitoring Frequency
3.4 Monitoring Equipment and Methodology
3.5 Laboratory Measurement and Analysis
3.7 Updated Dry Season Baseline Monitoring Results and Observations
4.1 Revision for Inclusion in the EM&A Manual
List of Tables
|
Table 2.1 |
Baseline Air Quality Monitoring Equipment |
|
Table 2.2 |
Baseline Air Quality Monitoring Parameters, Frequency and Duration |
|
Table 2.3 |
Original Air Quality Monitoring Stations for Baseline and Impact Monitoring |
|
Table 2.4 |
Updated Air Quality Monitoring Stations for Baseline and Impact Monitoring |
|
Table 2.5 |
Photo of Baseline Air Quality Monitoring Stations |
|
Table 2.6 |
Summary of Baseline 1-hour TSP Monitoring Results |
|
Table 2.7 |
Action and Limit Levels for Air Quality during Construction Period |
|
Table 2.8 |
Calculated Action and Limit Levels for 1-hour TSP |
|
Table 3.1 |
Parameters measured in the Baseline Water Quality Monitoring |
|
Table 3.2 |
Original Baseline Water Quality Monitoring Stations |
|
Table 3.3 |
Updated Location of Baseline Water Quality Monitoring Stations |
|
Table 3.4 |
Baseline Water Quality Monitoring Equipment |
|
Table 3.5 |
Detection Limits and Precision for Water Quality Determinates |
|
Table 3.6 |
Analytical Methods Applied to Water Quality Samples |
|
Table 3.7 |
Summary of Wet Season Baseline Water Quality Monitoring Results |
|
Table 3.8 |
Summary of Dry Season Baseline Water Quality Monitoring Results |
|
Table 3.9 |
Determination of Action and Limit Levels of Water Quality for Impact Monitoring |
|
Table 3.10 |
Summary of Excluded Value for Determination of Action and Limit Levels |
|
Table 3.11 |
Derived Wet Season Action and Limit Levels for Water Quality |
|
Table 3.12 |
Derived Dry Season Action and Limit Levels for Water Quality |
List of Figures
|
Figure 1.1 |
Project Layout Plan |
|
Figure 2.1 |
Air Quality Monitoring Locations |
|
Figure 2.2 |
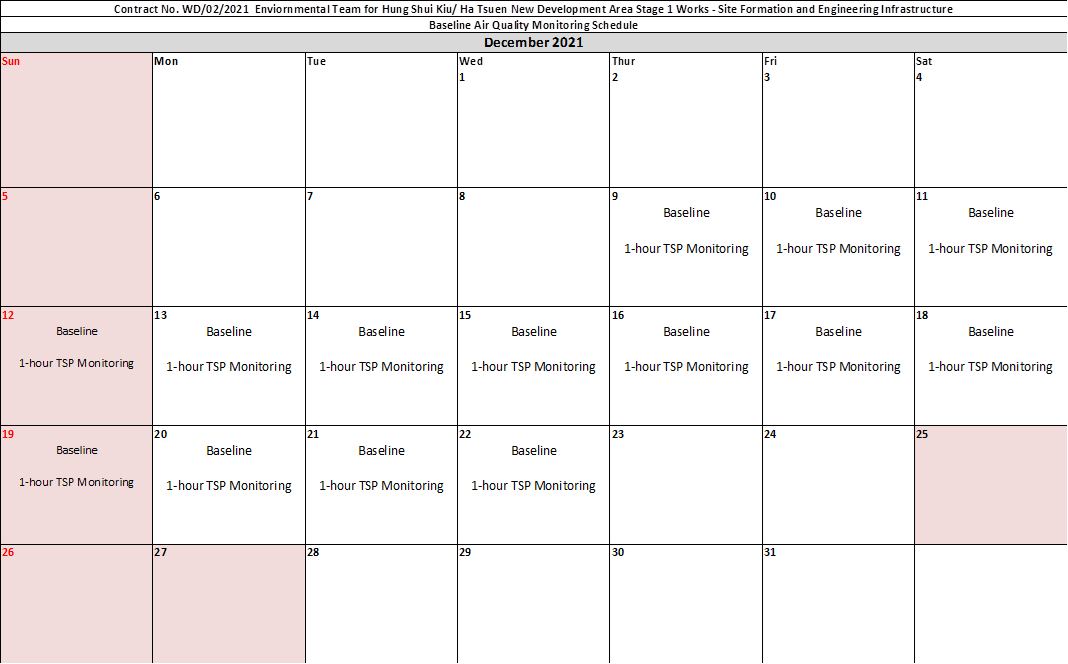
Baseline Air Quality Monitoring Schedule |
|
Figure 3.1 |
Locations of Baseline Water Quality Monitoring Stations |
|
Figure 3.2 |
Wet Season Baseline Water Quality Monitoring Schedule |
|
Figure 3.3 |
Dry Season Baseline Water Quality Monitoring Schedule |
List of Appendices
|
Appendix A |
Air Quality and Water Quality Monitoring Equipment Calibration Certificates |
|
Appendix B |
Baseline Air Quality Monitoring Results and Graphical Presentation |
|
Appendix C |
Wet Season Baseline Water Quality Monitoring Data and Graphical Presentation |
|
Appendix D |
|
|
Appendix E |
|
|
Appendix F |
|
|
Appendix G |
Extract of Meteorological Observations for Hong Kong Lau Fau Shan |
|
Appendix H |
Dry Season Baseline Water Quality Monitoring Data and Graphical Presentation |
EXECUTIVE SUMMARY
In accordance with the Updated Environmental Monitoring and Audit Manual (April 2022) for the Project, baseline environmental monitoring for air quality and water quality should be conducted prior to the commencement of construction works of the interim section of Road D1. Pursuant to EP Condition 3.3, Baseline Monitoring Report shall be submitted to the Director of Environmental Protection at least 2 weeks before the commencement of construction of the Project. As the construction works would commence by end of 2022, baseline monitoring for air quality and water quality were conducted according to the Updated Environmental Monitoring and Audit Manual (April 2022) before the commencement of construction works.
The baseline monitoring for 1-hour TSP monitoring was carried out between 9 December 2021 and 22 December 2021 at three air quality monitoring stations. Baseline 1-hour TSP monitoring was conducted at least three times per day at each monitoring station when the highest dust impact was expected. Data collected were reviewed and analyzed to establish the background air quality at three monitoring stations. Table 2.6 summarizes the results of the baseline 1-hour TSP monitoring.
The baseline 1-hour TSP monitoring results form the basis for determining the air quality criteria for the impact monitoring. Table 2.8 presents the Action and Limit Levels for impact monitoring of 1-hour TSP.
Baseline water quality monitoring was also carried out at six water quality monitoring stations. Data collected were reviewed and analyzed to establish the background water quality at these six monitoring stations. Table 3.7 summarizes the results of the wet season baseline water quality monitoring.
In view of the non-project related exceedances of action and limit levels recorded frequently in December 2022, review of the water quality baseline condition was proposed to reflect the baseline condition during dry season and to reduce the number of false alarms.
A baseline water quality monitoring during the dry season was conducted between 6 December 2022 and 30 December 2022. Table 3.8 summarizes the results of the dry season baseline water quality monitoring.
The dry season and wet season Action and Limit Levels for impact monitoring of water quality are presented in Table 3.10 and Table 3.11. They were derived based on the criteria specified in the Updated EM&A Manual.
1.1.1 The HSK/HT NDA occupies an area of approximately 714 ha and is located in the north-western part of the New Territories, midway between Tuen Mun and Tin Shui Wai New Towns. It is bounded by Tin Ying Road/ Ping Ha Road/ Kiu Hung Road to the east, Castle Peak Road to the south, Kong Sham Western Highway (KSWH) to the west, and Tin Ha Road, Lau Fau Shan Road and hillslopes along Deep Bay Road to the north. In the wider context, the proposed Project is strategically located in close proximity to Shenzhen, particularly Shenzhen Bay Control Point, Qianhai, and Shekou and efficiently linked with the Greater Pearl River Delta (PRD) region. The KSWH and the possible highway connecting the Project area with the Tuen Mun - Chek Lap Kok Link, the Hong Kong International Airport, Kwai Tsing Container Terminals, and the Hong Kong-Zhuhai-Macao Bridge and its Boundary Crossing facilities. New strategic highway infrastructure connecting the Project area with the urban area will also be planned to address the long-term development needs of North West New Territories (NWNT). The proposed West Rail Hung Shui Kiu Station (HSK Station), with its alignment traversing the Project allows convenient and efficient access to and from the Project area.
1.1.2 The works under HSK/HT NDA Stage 1 works comprises the construction of interim section of new distributor road (Road D1) (hereinafter call the Project) that is a designated project (DP) (defined under item A1 in Schedule 2 of the Environmental Impact Assessment Ordinance) connecting the site for the first batch of multi-storey buildings (MSBs) at Sites 3-6, 3-7 and 3-8 to the existing Ha Tsuen Roundabout of KSWH. The layout plan for this Project is shown in Figure 1.1.
1.1.3 The HSK/HT NDA Stage 1 works would be implemented under a fast track programme, involving various complex tasks for providing infrastructure and forming the five development sites to be conducted in parallel, so as to tie in with operation of the development MSBs or other land-efficient means and population intake of the village resite house in 2025 tentatively.
1.1.4 Acuity Sustainability Consulting Limited (ASCL) is commissioned by Civil Engineering and Development Department (CEDD) to undertake the Environmental Team (ET) services as required and/or implied, both explicitly and implicitly, in the Environmental Permit (EP), Environmental Impact Assessment (EIA) Report (Register No. AEIAR-203/2016) and Environmental Monitoring and Audit (EM&A) Manual for the Project; and to carry out the EM&A programme in fulfillment of the EIA Reports, EM&A requirements under Service Contract No. WD/02/2021.
1.1.5 Pursuant to the Environmental Impact Assessment Ordinance (EIAO), the Director of Environmental Protection Department (DEP) granted the Environmental Permits (Nos.: EP-526/2017, EP-527/2017, EP-528/2017, EP-529/2017, EP-530/2017 and EP-531/2017) to the CEDD for the Project. The HSK/HT NDA Stage 1 works comprise the interim section of Road D1 that is governed under Environmental Permit No. EP-528/2017. No other DPs are identified within the scope of HSK/HT NDA Stage 1 works.
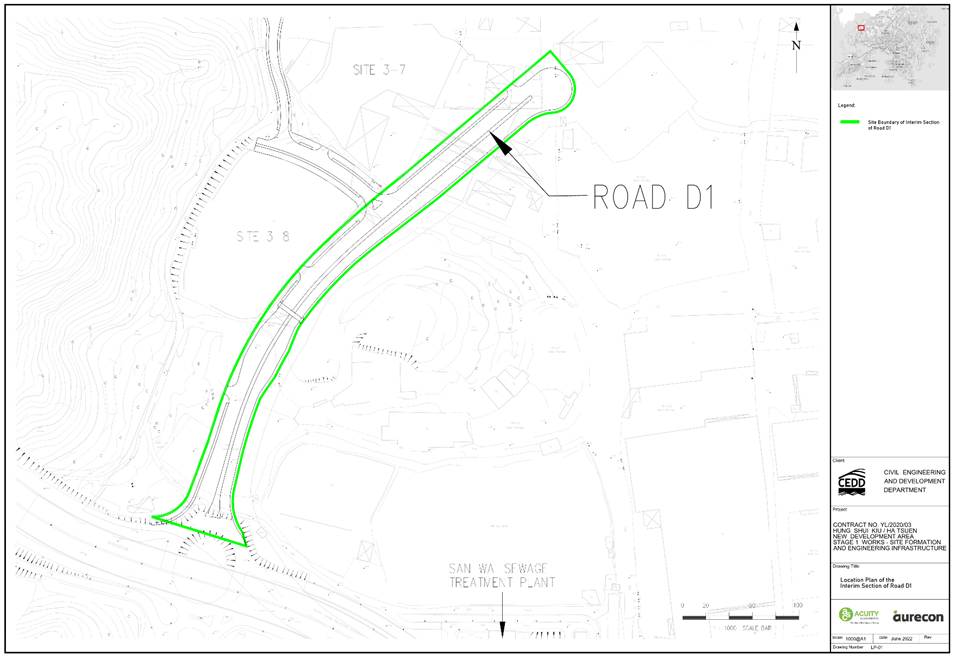
Figure 1.1 Project Layout Plan
1.2.1 According to Appendix A of the Updated EM&A Manual for the Project, baseline monitoring for air quality and water quality should be conducted prior to the commencement of construction works. No designated noise monitoring stations are located with the 300 m buffer zone of the interim section of Road D1. As such, baseline (and construction phase) noise monitoring for Road D1 (interim section) is not recommended.
1.2.2 The EM&A requirements for baseline monitoring under Contract No. YL/2020/03 are set out in the Updated EM&A Manual (April 2022) and Contract Specification. Environmental aspect of air quality and water quality were identified as the key issues requiring implementation of monitoring programme during the construction phase of the Project.
1.2.3 This report presents the monitoring methodology, findings and results for the baseline air quality and water quality monitoring of the Project. According to the Updated EM&A Manual (April 2022), baseline landscape and visual monitoring should also be conducted. The results are reported in a separate standalone Baseline Landscape and Visual Monitoring Report.
1.3 Report Structure
1.3.1 This Baseline Monitoring Report comprises the following sections:
Section 1 introduces the background of the Project and purpose of this Report;
Section 2 presents the baseline monitoring methodologies, requirements, results, influencing factors, as well as determination of the action and limit levels of air quality;
Section 3 presents the baseline monitoring methodologies, requirements, results, influencing factors, as well as determination of the action and limit levels of water quality; and
Section 4 concludes the findings of baseline monitoring.
2.1.1 Baseline air quality monitoring shall be carried out to determine the ambient 1-hour Total Suspended Particulates (TSP) levels at designated monitoring stations for 14 consecutive days prior to the commissioning of the construction works. 1-hour TSP monitoring should be carried out at least three times per day at each monitoring station when the highest dust impact are expected.
2.2 Monitoring Equipment and Methodology
2.2.1 Direct reading dust meters were used for measuring 1-hour TSP levels during the baseline air quality monitoring. According to paragraph 4.3.5 of the Updated EM&A Manual, the proposed use of direct reading dust meter was submitted to and agreed by the IEC.
2.2.2 The direct reading dust meters have been calibrated against high volume samples (HVSs) annually. A 2-day, three 3-hour measurement results per day from direct reading dust meters were taken to compare with the sampling results from the HVSs. The correlation between the direct reading dust meters and the HVSs were then concluded. By accounting for the correlation factor, the direct reading dust meters are considered to achieve comparable results as that of the HVSs.
2.2.3 Sufficient number of monitoring instruments were prepared by the ET for carrying out the baseline monitoring. All equipment and associated instrumentation were clearly labelled.
2.2.4 Equipment used in the baseline air quality monitoring programme is summarized in Table 2.1. Calibration certificates for the air quality monitoring equipment are attached in Appendix A.
Table 2.1 Baseline Air Quality Monitoring Equipment
|
Equipment |
Brand and Model |
Serial No. |
|
Direct Reading Dust Meter |
Aerocet 831 |
A14259 |
|
Sibata LD-5R |
851816 |
|
|
851820 |
||
|
992818 |
2.3 Monitoring Parameters, Frequency and Duration
2.3.1 Table 2.2 summarizes the monitoring parameters, frequency and duration of the baseline air quality monitoring.
Table 2.2 Baseline Air Quality Monitoring Parameters, Frequency and Duration
|
Parameters |
Duration |
Frequency |
|
1-hour TSP |
Daily for at least 14 consecutive days |
3 times per day |
2.4.1 According to the environmental findings detailed in the EIA report, the designated locations for the air quality monitoring are listed in Table 2.3.
Table 2.3 Original Air Quality Monitoring Stations for Baseline and Impact Monitoring
|
Station(s) |
EIA ID |
Monitoring Location |
|
AM23 |
P1032 |
Planned Port Back-up, Storage and Workshop (at Site 3-6) |
|
AM24 |
P1501 |
Planned Port Back-up, Storage and Workshop (at Site 3-8) |
|
AM25 |
P606 |
Planned Port Back-up, Storage and Workshop (at Site 3-14) |
(i) At location close to the major dust emission source;
(ii) Close to the (planned) air sensitive receivers as defined in the EIAO-TM;
(iii) Proper position/ sitting and orientation of the monitoring equipment; and
(iv) Take into account the prevailing meteorological conditions (the prevailing meteorological conditions at AM25 and AM25a will be very similar as they are located at a flat land without barriers and around 100 m away from each other).
2.4.3 The Proposal for Alternative Monitoring Station (Air Quality) for monitoring station AM25a has been verified by the IEC and endorsed by the EPD. The updated locations for air quality monitoring are listed in Table 2.4.Table 2.4 Updated Air Quality Monitoring Stations for Baseline and Impact Monitoring
|
Station(s) |
EIA ID |
Monitoring Location |
|
AM23 |
P1032 |
Planned Port Back-up, Storage and Workshop (at Site 3-6) |
|
AM24 |
P1501 |
Planned Port Back-up, Storage and Workshop (at Site 3-8) |
|
AM25a |
- |
San Wai Sewage Treatment Plant near the Planned Port Back-up, Storage and Workshop (at Site 3-14) |
Table 2.5 Photos of Baseline Air Quality Monitoring Stations
|
ID |
Direct reading dust meter Position |
Monitoring direction |
|
AM23 |
|
|
|
AM24 |
|
|
|
AM25a |
|
|
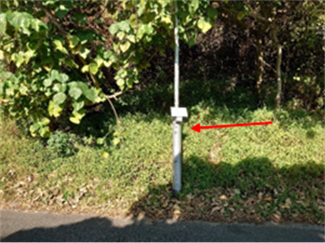
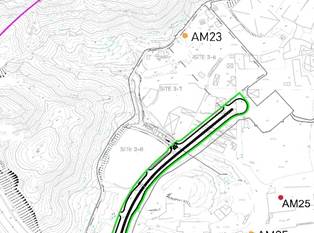
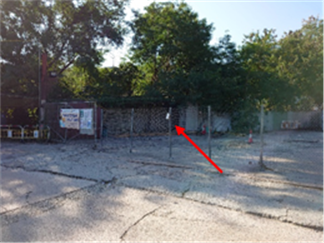
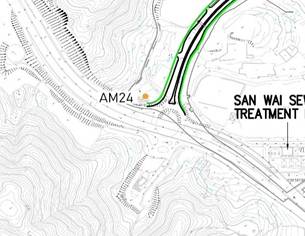
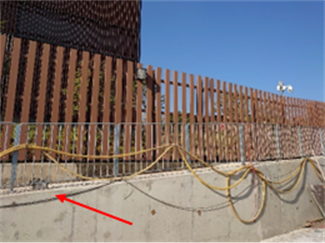
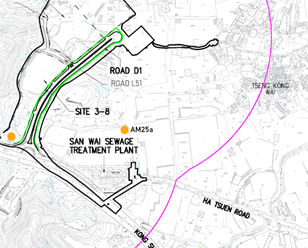
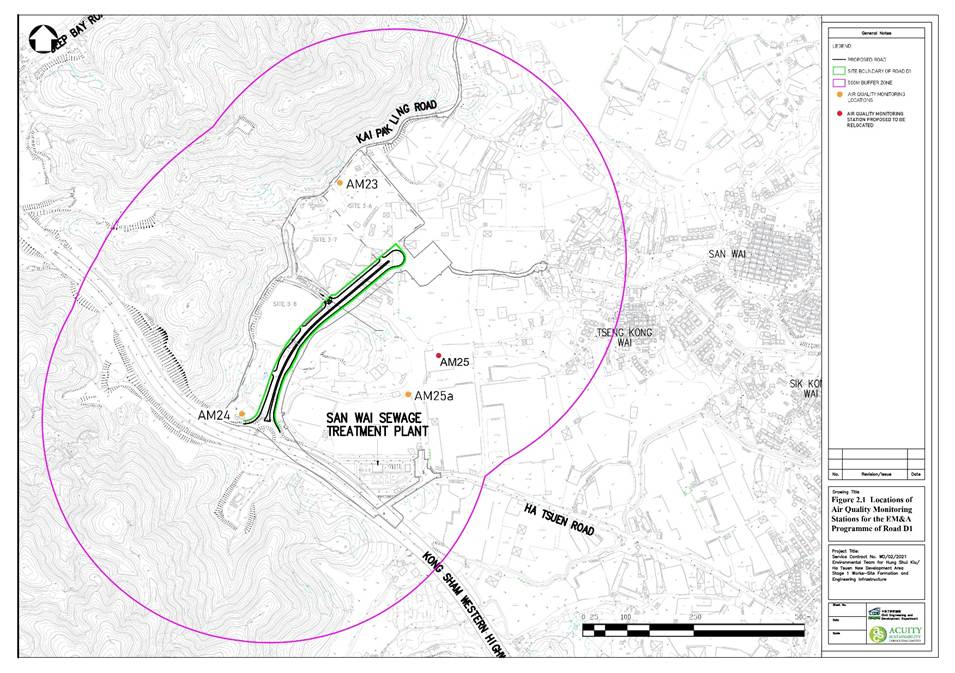
Figure 2.1 Air Quality Monitoring Locations
2.5.1 Baseline monitoring for air quality was conducted from 9 December 2021 to 22 December 2021 (Figure 2.2). The baseline air quality monitoring result are summarized in Table 2.6. Details of air quality results are presented in Appendix B.
2.5.2 During the baseline monitoring, no construction activity or dust generating activities of the Project and any other projects was conducted in the vicinity of the monitoring locations and in the project site. No project or any other project were observed affecting the baseline air quality condition during the baseline monitoring.
2.5.3 No other major dust emission sources were noted. Weather condition of the whole baseline monitoring period was sunny and fine. Extracts of Meteorological Observations for Hong Kong available from the Hong Kong Observatory Lau Fau Shan, which reflect the weather summary of the baseline air quality monitoring period, are presented in Appendix G.
Table 2.6 Summary of Baseline 1-hour TSP Monitoring Results
|
Monitoring Station (s) |
TSP Concentration, μg/m3 |
||
|
Average |
Min. |
Max. |
|
|
AM23 - Planned Port Back-up, Storage and Workshop (at Site 3-6) |
62.1 |
51.0 |
71.0 |
|
AM24 - Planned Port Back-up, Storage and Workshop (at Site 3-8) |
61.5 |
51.0 |
70.0 |
|
AM25a - San Wai Sewage Treatment Plant near the Planned Port Back-up, Storage and Workshop (at Site 3-14) |
77.2 |
62.0 |
98.0 |
2.6.1 The baseline 1-hour TSP monitoring results form the basis for determining the air quality criteria for the impact monitoring. Table 2.7 shows the criteria for establishing the Action and Limit Levels for air quality monitoring.
Table 2.7 Action and Limit Levels for Air Quality during Construction Period
|
Parameters |
Action Level (µg/m3) |
Limit Level (µg/m3) |
|
1-hour TSP Level (µg/m3) |
BL ≤ 384 µg/m3, AL = (BL × 1.3 + LL)/2 BL > 384 µg/m3, AL = LL |
500 |
Table 2.8 Calculated Action and Limit Levels for 1-hour TSP
|
Monitoring Station(s) |
Action Level (µg/m3) |
Limit Level (µg/m3) |
|
AM23 |
290.4 |
500 |
|
AM24 |
290.0 |
|
|
AM25a |
300.2 |
Figure 2.2 Baseline Air Quality Monitoring Schedule
3 WATER QUALITY
3.1.1 In accordance with the recommendations of the EIA Report (EIAO Register No. AEIAR-203/2016) and the Updated EM&A Manual (April 2022), the baseline water quality monitoring was conducted to establish baseline conditions prior to the commencement of the construction works. The baseline conditions for water quality were established to derive the Action and Limit levels for impact stations.
3.2 Water Quality Parameters and Monitoring Frequency
3.2.1 The parameters that have been selected for measurement in-situ and in the laboratory are those that are either determined in the EIA to be those with the most potential to be affected by the construction works or a standard check on water quality conditions. Parameters to be measured in the baseline water quality monitoring are listed in Table 3.1.
Table 3.1 Parameters measured in the Baseline Water Quality Monitoring
|
Parameters |
Units |
Abbreviations |
Frequency |
|
In-situ measurements |
3 days per week for at least 4 weeks (the interval between 2 sets of monitoring should not be less than 36 hours) |
||
|
Dissolved oxygen |
mg/L |
DO |
|
|
Dissolved oxygen saturation |
% |
DO% |
|
|
Temperature |
oC |
- |
|
|
pH |
- |
- |
|
|
Turbidity |
NTU |
- |
|
|
Laboratory measurements |
|||
|
Suspended Solids |
mg/L |
SS |
|
3.2.2 In addition to the water quality parameters, other relevant data were also being measured and recorded in data record sheet, including the location of the sampling stations, time, weather conditions, special phenomena and work activities undertaken around the monitoring stations and works area that may influence the monitoring results.
3.3.1 The baseline water quality monitoring stations in accordance with the Updated EM&A Manual are shown in Figure 3.1 and detailed in Table 3.2 below.
Table 3.2 Original Baseline Water Quality Monitoring Stations
|
Station |
Description |
Easting |
Northing |
|
U1 |
Upstream Station |
815936 |
834150 |
|
U2 |
Upstream Station |
816240 |
834009 |
|
SW |
Gradient station (downstream of U1 and the construction site of Road D1) |
816304 |
834321 |
|
HT |
Gradient station (downstream of U2 and the construction site of Road D1) |
816866 |
834314 |
|
DB |
Gradient station |
816091 |
834976 |
3.3.2 During the site visit in November 2021, water quality monitoring station DB was surrounded by scrubs and vegetation. It is located at a natural stream channel running along the steep slope of the hill to the south-west of Fung Kong Tsuen. The watercourse runs towards the north of Road D1 but, based on the information from the governments GeoInfo Map and the site visit, no downstream watercourse was identified. Thus, water quality monitoring station DB is not recommended for this Contract without upstream/ downstream monitoring locations identified.
3.3.3 A new water quality monitoring station TKW was proposed at an open manmade channel downstream of Road D1 near Tseung Kong Wai and is within the 500 m assessment area of Road D1. Another monitoring location TKW1 about 20 m upstream of TKW at an open channel was also proposed (refer to Annex A of the Updated EM&A Manual for details). The Proposal has been verified by the IEC and endorsed by the EPD. The updated Baseline Water Quality Monitoring Stations are shown in Figure 3.1 and detailed in Table 3.3 below.
Table 3.3 Updated Locations of Baseline Water Quality Monitoring Stations
|
Station |
Description |
Easting |
Northing |
|
U1 |
Upstream Station |
815936 |
834150 |
|
U2 |
Upstream Station |
816240 |
834009 |
|
SW |
Gradient station (downstream of U1 and the construction site of Road D1) |
816304 |
834321 |
|
HT |
Gradient station (downstream of U2 and the construction site of Road D1) |
816866 |
834314 |
|
TKW1 |
Gradient station (downstream of the construction site of Road D1) |
816563 |
834686 |
|
TKW |
Gradient station (downstream of TKW1 and construction site of Road D1) |
816594 |
834690 |
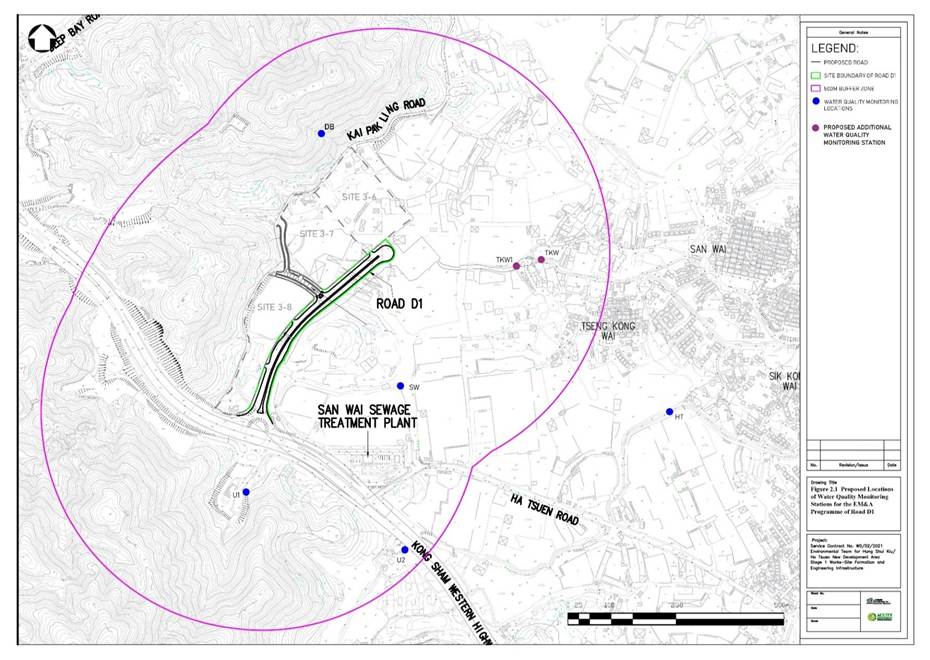
Figure 3.1 Locations of Baseline
Water Quality Monitoring Stations![]()
3.4 Monitoring Equipment and Methodology
3.4.1 In-situ measurements at monitoring locations including DO, DO%, pH, temperature and turbidity were collected using the equipment listed in Table 3.4 and the detection limit for the in-situ measurement are shown in Table 3.5. Calibration certificates for the water quality monitoring equipment are attached in Appendix A.
3.4.2 Water samples for suspended solids (SS) analysis were stored in high density polythene bottles, packed in ice (cooled to 4 ºC without being frozen), and delivered to a HOKLAS laboratory as soon as possible after collection of the water samples.
Table 3.4 Baseline Water Quality Monitoring Equipment
|
Equipment |
Brand and Model |
Quantity |
|
Water Sampler |
Kahlsico Water Sampler 13SWB20 |
1 |
|
Multi Parameter Water Quality System |
HORIBA U-53 |
2 |
Table 3.5 Detection Limits and Precision for Water Quality Determinates
|
Parameters |
Detection limit |
Accuracy |
Precision |
|
DO |
0 20 mg/L |
± 0.1 mg/L |
25% |
|
Temperature |
0 45 oC |
± 0.1 oC |
|
|
pH |
0 14 |
± 0.1 |
|
|
Turbidity |
0 1000 NTU |
± 2 |
3.4.3 During the baseline monitoring, the depths of waters at the monitoring stations were all less than 3 m. Thus, only mid-depth samples were collected. For in situ measurements, duplicate readings were made at each station. Duplicate water samples were also collected at each station.
3.4.4 In-situ monitoring instruments for water quality parameters were checked, calibrated and certified by a laboratory accredited under HOKLAS before use. Responses of sensors and electrodes were checked with certified standard solutions before each use. Wet bulb calibration for a DO meter was carried out before measurement at each monitoring day.
3.5 Laboratory Measurement and Analysis
3.5.1 Analysis of SS was carried out in a HOKLAS accredited laboratory, Acumen Laboratory and Testing Limited (Reg. No. HOKLAS 241). Sufficient water samples were collected at each of the monitoring stations for carrying out the laboratory SS determination.
3.5.2 The SS determination works started within 24 hours after collection of the water samples. The analysis followed the APHA 2540D analytical method with the detection limit of 1.0 mg/L. The quality assurance and quality control results are presented in Appendix D. The HOKLAS Laboratory Certificate is attached in Appendix F.
3.5.3 Parameters for laboratory measurements, their standard methods and the detection limits are presented in Table 3.6.
Table 3.6 Analytical Methods Applied to Water Quality Samples
|
Parameter |
Standard Method |
Detection Limit |
Accuracy |
|
Suspended Solids (mg/L) |
APHA 2540D |
1.0 mg/L |
±17% |
3.6.2 The monitoring results are summarized in Table 3.7. Details of wet season water quality monitoring results are presented in Appendix C.
Table 3.7 Summary of Wet Season Baseline Water Quality Monitoring Results
|
Locations |
Parameters |
|||||
|
Temperature (°C) |
pH |
DO (mg/L) (Middle) |
Turbidity (NTU) |
SS (mg/L) |
||
|
U1 |
Avg. |
22.6 |
8.1 |
7.3 |
17.5 |
12.8 |
|
Min. |
19.9 |
7.3 |
4.3 |
4.7 |
3.7 |
|
|
Max. |
26.8 |
9.1 |
10.5 |
53.2 |
36.0 |
|
|
U2 |
Avg. |
22.7 |
7.9 |
7.1 |
8.3 |
5.4 |
|
Min. |
20.3 |
7.3 |
3.4 |
2.5 |
1.3 |
|
|
Max. |
26.3 |
8.6 |
10.7 |
24.3 |
16.0 |
|
|
SW |
Avg. |
22.7 |
7.9 |
7.2 |
11.5 |
6.2 |
|
Min. |
20.2 |
7.4 |
3.5 |
1.9 |
<1.0 |
|
|
Max. |
26.4 |
8.6 |
10.7 |
23.2 |
24.0 |
|
|
HT |
Avg. |
22.6 |
8.0 |
6.9 |
16.2 |
15.4 |
|
Min. |
20.2 |
7.3 |
2.2 |
2.8 |
<1.0 |
|
|
Max. |
26.1 |
8.7 |
10.6 |
45.1 |
69.0 |
|
|
TKW1 |
Avg. |
22.7 |
8.0 |
7.7 |
14.3 |
9.4 |
|
Min. |
20.3 |
7.4 |
2.8 |
3.4 |
<1.0 |
|
|
Max. |
26.4 |
8.7 |
10.8 |
63.2 |
54.0 |
|
|
TKW |
Avg. |
22.7 |
7.9 |
7.0 |
14.4 |
10.2 |
|
Min. |
20.2 |
7.4 |
2.4 |
4.0 |
<1.0 |
|
|
Max. |
26.3 |
8.7 |
10.3 |
57.3 |
52.0 |
|
3.6.3 During the wet season baseline water quality monitoring, significant high pH value was observed at all monitoring stations on 14, 24 and 29 May 2022 with range from 8.5 to 9.1. The particularly high pH values at all monitoring stations appear unusual but are potentially attributed to the domestic discharge from unsewered village and contaminated water from nearby brownfield site.
3.6.4 The wet season baseline water quality monitoring results also indicated that fluctuations of DO, turbidity and SS levels varied over time. It is noticed that extraordinarily high levels of turbidity and SS that might not truly reflect the background condition were occasionally recorded during the baseline monitoring. Without knowing the reasons of these high levels, the turbidity and SS data that are considered as outliers using standard deviation method and were excluded in the formulation of the Action and Limit Levels.
3.6.5 According to the EIA Report (Register No. AEIAR-203/2016) Section 5 Water Quality Impact, water quality sampling was conducted during the EIA Study, the river quality of Tin Shui Wai Main Channel, Hang Hau Tsuen Channel was subjected to domestic discharge from unsewered villages or expedient connections/ contaminated run-off in the study area.
3.6.6 As the proposed construction of interim section of new distributor road (Road D1) are surrounded by the existing villages and brownfield sites/ open storage areas, watercourses are likely receiving expedient connections of sewage from these villages and contaminated run-off from the brownfield sites/ open storage areas. Thus, the water quality would be affected by the runoff and effluent from the nearby villages and brownfield sites during the impact water quality monitoring.
3.6.7 In contrast to wet season, rainfall is less during dry season and the volume of stream flow is usually lower. The background water quality conditions during the wet and dry seasons would also be different. Therefore, it is recommended to regularly review the water quality baseline conditions during the construction phase of the Project. The environmental performance criteria may need to be re-established if it is evident that the baseline conditions have changed significantly. Updated baseline data should then be sought for re-establishment of the updated environmental performance criteria.
3.7 Dry Season Baseline Monitoring Results
3.7.1 During the first month (December 2022) of construction phase EM&A programme, non-project related exceedances of action and limit levels were recorded frequently. After site investigation, no evidence was found to indicate that the water quality monitored between 6 and 30 December 2022 was affected by the site activities. The exceedances were considered to be caused by other composite factors including surface runoff and effluent discharges from the workshops, open storages, warehouses, private toilet(s) and residential dwellings along the catchment downstream of the site, as well as natural variation of upstream water quality.
3.7.2 To reduce the number of false alarms, a review of the water quality baseline condition was proposed to reflect the baseline condition during the dry season.
3.7.3 Water quality monitoring data collected at all six monitoring stations (i.e., U1, U2, SW, HT, TKW1, TKW) during the first month of the construction phase EM&A programme (between 6 December 2022 and 30 December 2022, Figure 3.3) were adopted as the baseline water quality data to derive the Action and Limit Levels of the dry season.
3.7.4 The dry season baseline water quality monitoring results are summarized in Table 3.8. Details of dry season water quality monitoring results are presented in Appendix H.
Table 3.8 Summary of Dry Season Baseline Water Quality Monitoring Results
|
Locations |
Parameters |
|||||
|
Temperature (°C) |
pH |
DO (mg/L) (Middle) |
Turbidity (NTU) |
SS (mg/L) |
||
|
U1 |
Avg. |
15.0 |
7.7 |
5.8 |
10.1 |
11.4 |
|
Min. |
12.2 |
6.8 |
3.0 |
4.2 |
1.2 |
|
|
Max. |
18.0 |
8.7 |
7.6 |
21.0 |
98.0 |
|
|
U2 |
Avg. |
15.4 |
7.3 |
6.6 |
7.4 |
2.2 |
|
Min. |
11.5 |
6.9 |
2.4 |
3.7 |
1.0 |
|
|
Max. |
17.9 |
7.7 |
8.1 |
18.7 |
4.2 |
|
|
SW |
Avg. |
15.5 |
7.5 |
3.6 |
10.4 |
4.9 |
|
Min. |
3.2 |
7.1 |
1.9 |
2.8 |
1.0 |
|
|
Max. |
20.1 |
8.2 |
4.9 |
22.4 |
16.0 |
|
|
HT |
Avg. |
16.1 |
7.5 |
2.8 |
9.7 |
3.6 |
|
Min. |
11.8 |
7.2 |
2.1 |
1.2 |
1.0 |
|
|
Max. |
18.8 |
8.0 |
5.8 |
31.6 |
8.3 |
|
|
TKW1 |
Avg. |
16.5 |
7.5 |
2.8 |
9.5 |
3.8 |
|
Min. |
12.0 |
7.0 |
2.0 |
2.5 |
1.0 |
|
|
Max. |
20.0 |
8.2 |
4.3 |
17.9 |
12.0 |
|
|
TKW |
Avg. |
16.4 |
7.4 |
2.9 |
12.0 |
3.9 |
|
Min. |
11.2 |
7.1 |
2.2 |
3.3 |
1.9 |
|
|
Max. |
19.9 |
8.1 |
4.2 |
26.8 |
7.6 |
|
Figure 3.2 Wet Season Baseline Water Quality Monitoring Schedule
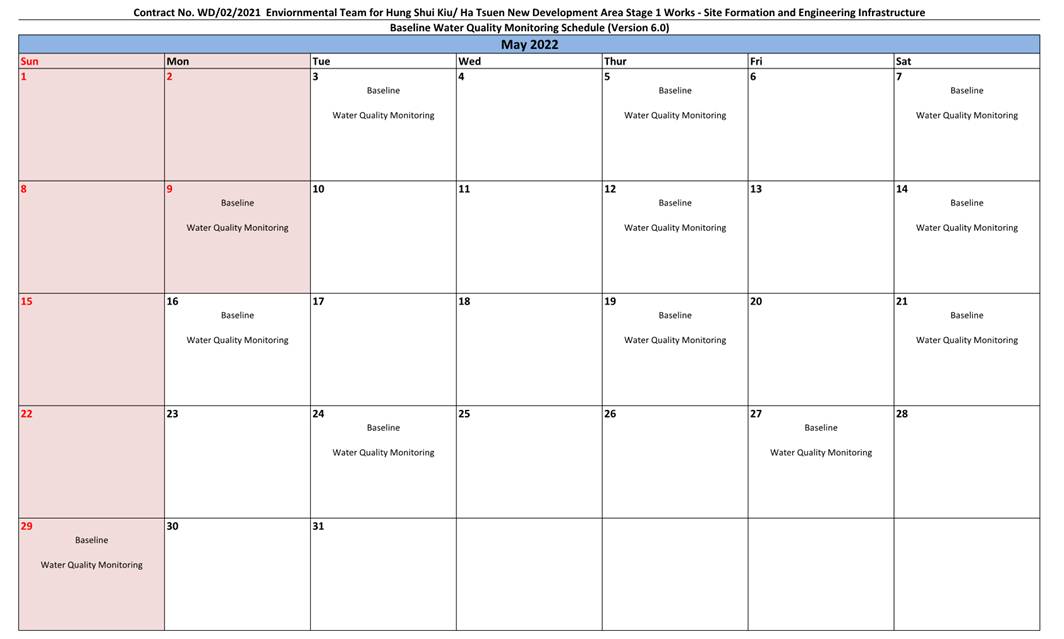
Figure 3.3 Dry Season Baseline Water Quality Monitoring Schedule

3.8.2 Based on the baseline water quality monitoring data and the approach specified above, the Action and Limit Levels for wet season and dry season were derived and are presented in Table 3.10 and Table 3.11. As discussed in Section 3.6.4, the extraordinarily high values of DO, turbidity and SS data recorded during the baseline monitoring were excluded in the determination of action and limit Levels using standard deviation method and the excluded values were highlighted in Appendix C and Appendix H.
3.8.3 The derived dry season action and limit levels for water quality monitoring will be applied to the monitoring period between November and March and the derived wet season action and limit levels will be applied to April to October.
Table 3.9 Determination of Action and Limit Levels of Water Quality for Impact Monitoring
|
Parameters |
Action |
Limit |
|
DO in mg/L |
Surface and Middle, Bottom DO ≤5%-ile of baseline data |
Surface and Middle DO ≤4 mg/L and 1%-ile of baseline data for surface and middle layers Bottom DO ≤2 mg/L and 1%-ile of baseline data for bottom layer |
|
SS in mg/L |
Depth-averaged SS · ≥ 95%-ile of baseline data or · 120% of upstream control station of the same day (applicable to station at SW and HT only) |
Depth-averaged SS · ≥ 99%-ile of baseline data or · 130% of upstream control station of the same day (applicable to station at SW and HT only) |
|
Turbidity in NTU |
Depth-averaged Turbidity · ≥ 95%-ile of baseline data or · 120% of upstream control station of the same day (applicable to station at SW and HT only) |
Depth-averaged Turbidity · ≥ 99%-ile of baseline data or · 130% of upstream control station of the same day (applicable to station at SW and HT only |
|
pH |
Beyond the range 6.6 8.4 |
Beyond the range of 6.5 8.5 |
(1) For DO, non-compliance of the water quality limit occurs when monitoring result is lower than the limit.
(2) For SS and turbidity, non-compliance of the water quality limit occurs when monitoring result is higher than the limit.
Table 3.10 Derived Wet Season Action and Limit Levels for Water Quality
|
Parameters |
Action Levels |
Limit Levels |
|
SW |
||
|
DO (mg/L) (3) |
3.7 |
3.5 |
|
Turbidity (NTU) |
21.4 |
22.9 |
|
SS (mg/L) |
9.7 |
9.9 |
|
pH |
Less than 6.6 or greater than 8.4 |
Less than 6.5 or greater than 8.5 |
|
HT |
||
|
DO (mg/L) (3) |
2.4 |
2.2 |
|
Turbidity (NTU) |
32.3 |
32.6 |
|
SS (mg/L) |
34.0 |
38.7 |
|
pH |
Less than 6.6 or greater than 8.4 |
Less than 6.5 or greater than 8.5 |
|
TKW1 |
||
|
DO (mg/L) (3) (4) |
2.8 |
2.8 |
|
Turbidity (NTU) |
27.9 |
29.2 |
|
SS (mg/L) |
16.0 |
18.4 |
|
pH |
Less than 6.6 or greater than 8.4 |
Less than 6.5 or greater than 8.5 |
|
TKW |
||
|
DO (mg/L) (3) |
2.5 |
2.4 |
|
Turbidity (NTU) |
24.2 |
24.6 |
|
SS (mg/L) |
19.8 |
21.6 |
|
pH |
Less than 6.6 or greater than 8.4 |
Less than 6.5 or greater than 8.5 |
Notes:
(1) For DO, non-compliance of the water quality limit occurs when monitoring result is lower than the limit.
(2) For Turbidity and SS, non-compliance of the water quality limit occurs when monitoring result is higher than the limit.
(3) The derived Action Levels and Limit Levels for dissolved oxygen only apply to mid-depth.
(4) The derived action and limit level for DO at TKW1 come up with the same value at 2.8 mg/L. If monitoring result exceeded 2.8 mg/L, it will be considered as limit level exceedance, and actions according to the Event and Action Plan will be carried out.
Table 3.11 Derived Dry Season Action and Limit Levels for Water Quality
|
Parameters |
Action Levels |
Limit Levels |
|
SW |
||
|
DO (mg/L) (3) |
2.3 |
2.1 |
|
Turbidity (NTU) |
22.0 |
22.3 |
|
SS (mg/L) |
8.8 |
10.5 |
|
pH |
Less than 6.6 or greater than 8.4 |
Less than 6.5 or greater than 8.5 |
|
HT |
||
|
DO (mg/L) (3) |
2.2 |
2.1 |
|
Turbidity (NTU) |
18.2 |
20.1 |
|
SS (mg/L) |
7.2 |
7.5 |
|
pH |
Less than 6.6 or greater than 8.4 |
Less than 6.5 or greater than 8.5 |
|
TKW1 |
||
|
DO (mg/L) (3) |
2.1 |
2.0 |
|
Turbidity (NTU) |
16.4 |
17.6 |
|
SS (mg/L) |
7.1 |
7.8 |
|
pH |
Less than 6.6 or greater than 8.4 |
Less than 6.5 or greater than 8.5 |
|
TKW |
||
|
DO (mg/L) (3) (4) |
2.2 |
2.2 |
|
Turbidity (NTU) |
26.0 |
26.7 |
|
SS (mg/L) |
7.0 |
7.1 |
|
pH |
Less than 6.6 or greater than 8.4 |
Less than 6.5 or greater than 8.5 |
Notes:
(1) For DO, non-compliance of the water quality limit occurs when monitoring result is lower than the limit.
(2) For Turbidity and SS, non-compliance of the water quality limit occurs when monitoring result is higher than the limit.
(3) The derived Action Levels and Limit Levels for dissolved oxygen only apply to mid-depth.
(4) The derived action and limit level for DO at TKW come up with the same value at 2.2 mg/L. If monitoring result exceeded 2.2 mg/L, it will be considered as limit level exceedance, and actions according to the Event and Action Plan will be carried out.
4.1 Revision for Inclusion in the EM&A Manual
4.1.1 The baseline monitoring was conducted according to the Updated EM&A Manual for air quality and water quality.
4.1.2 All updated air quality and water quality monitoring locations were verified by the IEC and approved by the EPD.
4.1.3 The monitoring methodology, parameters monitored, and monitoring locations are all generally in line with the Updated EM&A Manual for the Project.
4.2.1 Baseline air quality monitoring was carried out between 9 December 2021 and 22 December 2021 at three monitoring stations.
4.2.2 No construction activity of the Project was conducted in the vicinity of the monitoring locations and in the project site.
4.2.3 Action and Limit Levels were derived from the baseline 1-hour TSP monitoring results according to the Updated EM&A Manual.
4.3.1 Wet season baseline water quality monitoring was conducted between 3 May 2022 to 29 May 2022 at six monitoring stations (i.e. U1, U2, SW, HT, TKW1 and TKW).
4.3.2 In view of the non-project related exceedances of action and limit levels recorded frequently during the first month of the construction phase EM&A programme (December 2022), review of the water quality baseline condition was proposed to reflect the baseline condition during dry season and to reduce the number of false alarms.
4.3.3 Dry season baseline water quality monitoring was conducted between 6 December and 30 December 2022 at six monitoring stations (i.e. U1, U2, SW, HT, TKW1 and TKW).
4.3.4 Action and Limit Levels for wet season and dry season were derived from the baseline water quality monitoring results according to the Updated EM&A Manual.
4.3.5 The derived dry season action and limit levels for water quality monitoring will be applied to November to March and the derived wet season action and limit levels will be applied to April to October.
4.4.1 No further comment or recommendation was provided in this baseline monitoring report.